


Data quality is a broad concept with multiple dimensions. I detail that information in another introductory article. This tutorial explores a real-life example. We identify what we want to improve, create the code to achieve our goals, and wrap up with some comments about things that can happen in real-life situations. To follow along, you need a basic understanding of Python. This process has broad applications across the software development lifecycle, from QA to devops.
The pandas library
Python Data Analysis Library (pandas) is an open-source, BSD-licensed library that provides high-performance, easy-to-use data structures and data analysis tools for the Python programming language.
You can install pandas by entering this code in a command line: python3 -m pip install — upgrade pandas.
There are two primary classes of data structures in pandas:
- Series. A single column that can contain any type of data.
- DataFrame. A relational data table, with rows and named columns.
A DataFrame contains one or more Series and a name for each Series. DataFrames are commonly used abstractions, or complexity managers, for data manipulation.
Series structure
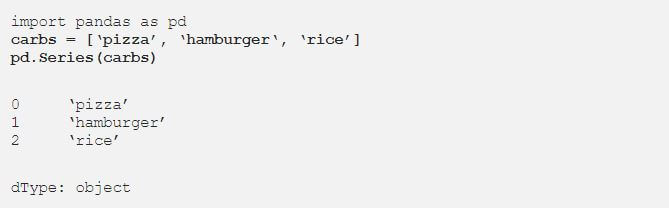
A Series is like a cross between a dictionary and a list. Items are stored in order, and they’re labeled so you can retrieve them. The first item in a Series list is the special index, which is a lot like a dictionary key. The second item is your actual data. It’s important to note that each data column has its own index label. You can retrieve them by using the .name attribute. This part of the structure is different than a dictionary, and it’s useful for merging multiple columns of data.
This quick example shows you what a Series looks like:
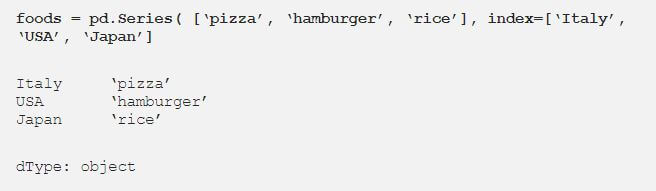
We can also create a Series with label attributes:
Query a Series
You can query a Series by the index position or by the index label. If you don’t give the Series an index, the position and label have the same value. To query by numeric location, use the iloc attribute.
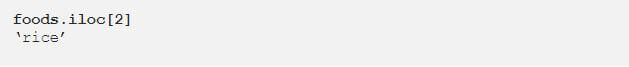
To query by the index label, use the loc attribute.

Keep in mind that one key can return multiple results. This example shows the basics. There are many other Series topics like vectorization, memory management, and more. But we won’t go that deep in this article.
DataFrame structure

A DataFrame is the main structure of the pandas library. It’s the primary object that you work within data analysis and cleaning tasks.
Conceptually, a DataFrame is a two-dimensional Series object. It has an index and multiple columns of content, and each column is labeled. But the distinction between a column and a row is only conceptual. Think of a DataFrame as a two-axis labeled array.
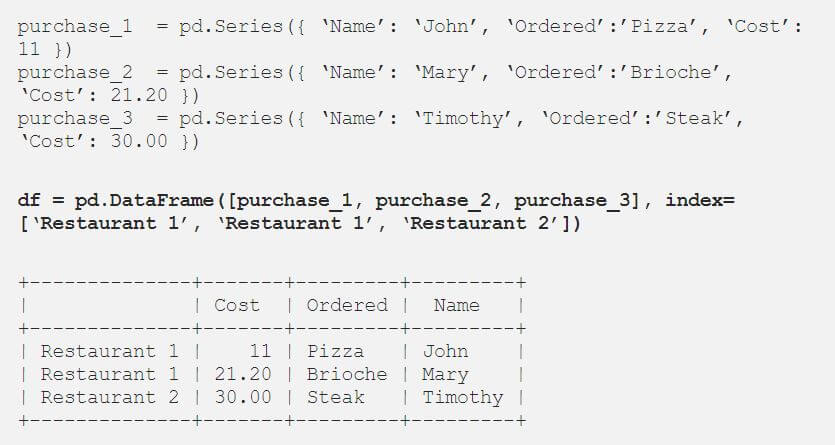
You can create the DataFrame table that follows by using Series:
Like with Series, we can extract data by using the iloc and loc attributes. DataFrames are two-dimensional. So when we pass a single value to the loc, the indexing operator returns a Series if there’s only one row to return.
Let’s query this DataFrame.
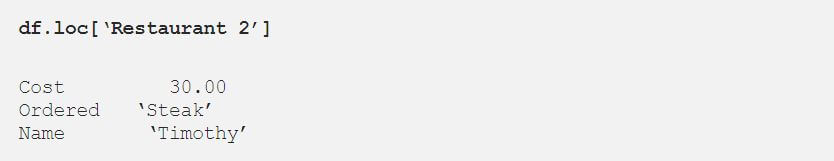
This function returns an object of the type Series.
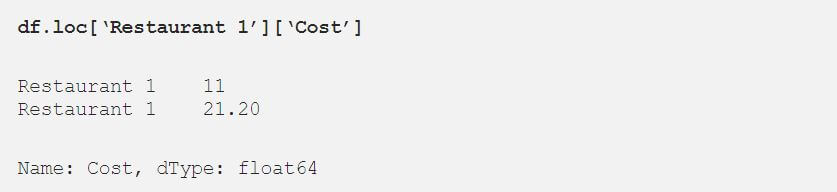
One powerful feature of the pandas DataFrame is that you can quickly select data based on multiple axes. Because iloc and loc are used for row selection, pandas developers reserved the indexing operator directly on the DataFrame for column selection. In a DataFrame, columns always have a name. So this selection is always label based.
As an example, we can rewrite the query for all Restaurant 1 costs with this code:
Showtime!
Now we tackle a simple but common problem with data: missing values. In Data Demystified — Data Quality, I explain why completeness is one of the dimensions to consider when you assess data quality. Missing data can also be related to two more dimensions: lack of accuracy or consistency. There’s a lot more to learn, but I want to jump straight to an example and introduce new concepts as we go.
We can read large datasets from any source. Some examples are relational databases, files, and NoSQL databases. This library example shows a set of methods that interact with a relational database:

Note that [.c-inline-code]connect[.c-inline-code] and [.c-inline-code]read_sql[.c-inline-code] are key methods.
For the sake of simplicity, we’ll work with a CSV file. Let’s say we have a log file that’s stored in logs.csv. This log stores the position of the mouse pointer every 100ms. If the mouse doesn’t change, the algorithm stores an empty value, but it adds a new entry to the row. Why? Because it’s not efficient to send this information across the network if it hasn’t changed.
Our goal is to have all the rows in the CSV file stored with the right coordinates. As shown in the table that follows, we can store the rows with this code:
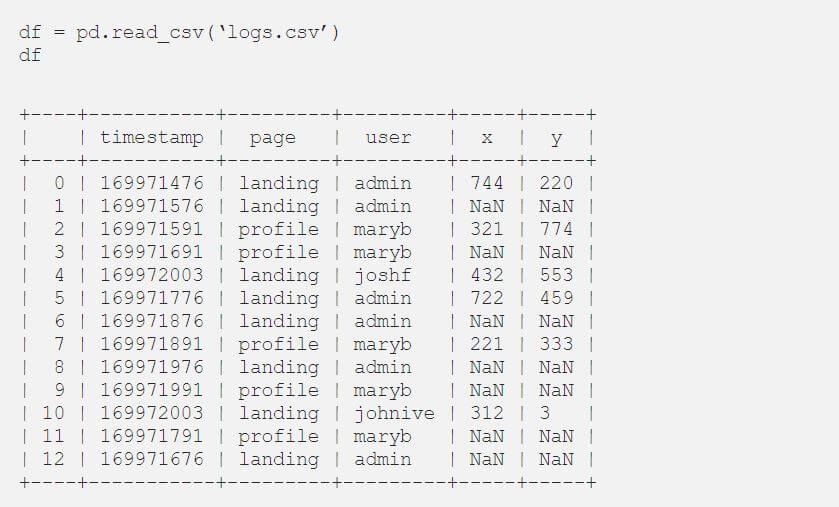
When we check the data, we see multiple problems. There are lots of empty values, and the file isn’t ordered by a timestamp. This issue is common in systems with a high degree of parallelism.
One function that can handle the empty data is fillna. For more information, enter df.fillna? in your command line. There are many options for working with this method:
- One option is to pass in a single scalar value that changes all the missing data to one value. But that change isn’t what we want.
- Another option is to pass a method parameter. The two common values are ffill and bfill. ffill fills cells going forward. It updates a NaN value in a cell with the value from the previous row. For this update to make sense, your data needs to be sorted in order. But traditional database management systems don’t usually guarantee any order to the data you extract from them.
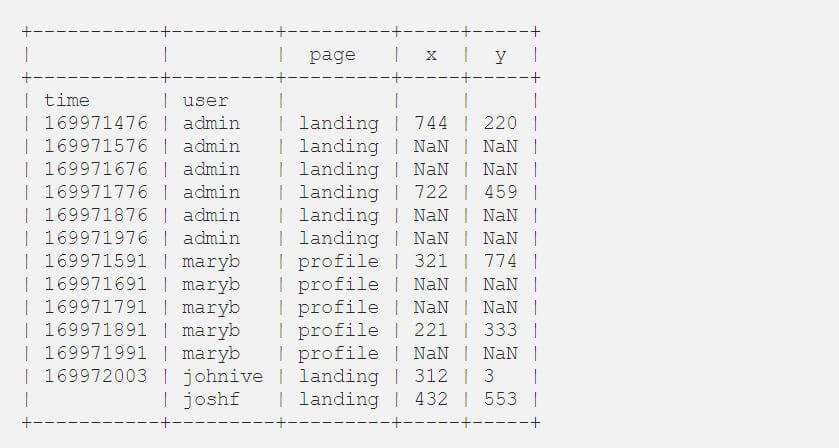
So, let’s sort the data first. We can sort either by index or by values. In this example, timestamp is the index, and we sort the index field:

We create the following table:
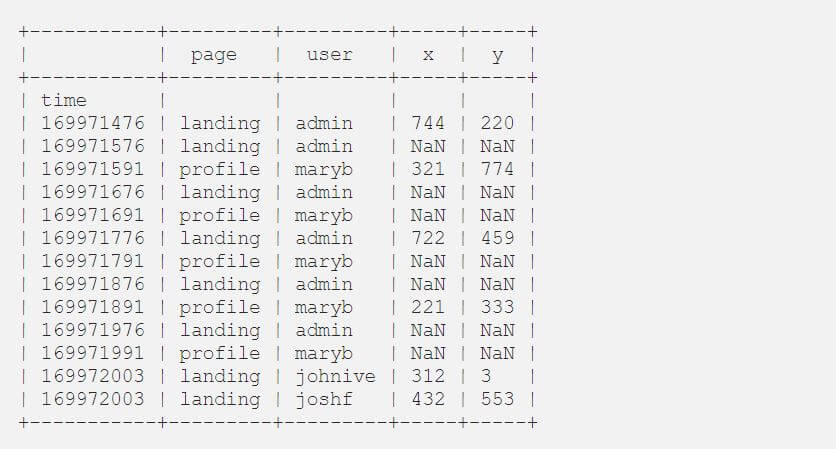
As you can see, there’s still a problem. Our timestamp isn’t unique. Two users might interact with the platform at the same time.
Let’s reset the index and create a compound index by using both timestamp and the username:
We create the following table:
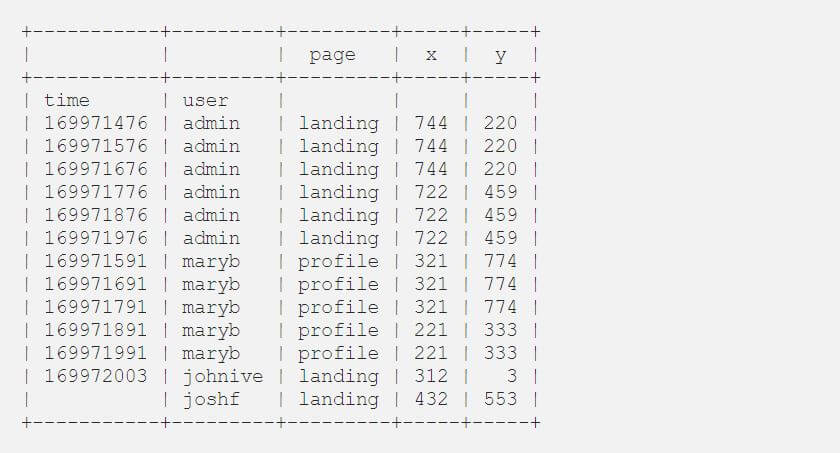
Now we can fill in the missing data with [.c-inline-code]ffill[.c-inline-code]:

This table shows the result:
pandas vs. PostgreSQL

pandas outperforms PostgreSQL. It runs 5 to 10 times faster for large datasets. The only time PostgreSQL performs better is with small datasets, usually less than a thousand rows. Selecting columns is efficient in pandas, with an O(1) time. That’s because the DataFrame is stored in memory.
For that same reason, pandas has limitations, and there’s still a need for SQL. pandas data is stored in memory. So it’s hard to load a CSV file that’s bigger than half the system’s memory. Datasets often contain hundreds of columns, which creates file sizes of around 10 GB for datasets with more than a million rows.
PostgreSQL and pandas are two different tools with overlapping functionality. PostgreSQL and other SQL-based languages were created to manage databases. They make it easy for users to access and retrieve data, especially across multiple tables.
- A server that runs PostgreSQL has all the datasets stored as tables across the system. It’s not practical for users to transfer the required tables to their systems and then use pandas to perform tasks like join and group on the client side.
- pandas’ specialty is data manipulation and complex data analysis operations.
The two tools don’t compete in the tech market. But rather, they add to the range of tools available in the data science computational stack.
Extra tip
The pandas team recently introduced a way to fill in missing values with a series that’s the same length as your DataFrame. With this new method, it’s easy to derive values that are missing if you need to do that.
References
Fox, D. (2018), Manipulating Data with pandas and PostgreSQL: Which is better?, The Data Incubator.
pandas (2019), Python Data Analysis Library.

.jpg)
