
Simulation can be used for emulating situations. It is used to simulate systems to be studied. This can be applied in any kind of system, banks, supermarkets, biological systems, traffic, etc. It can also be used to generate data with certain characteristics, either to complete missing information, to generate data more “similar” to the original one, or to generate “fake” data to be detected by your model.
Monte Carlo Simulation
Monte Carlo simulation refers to the process of incorporating randomness into the model by generating random values. Thus, it is a probability model of different outcomes based on the probability distribution of the random variable. A probability distribution describes the frequency and patterns in the values that the variable takes. It is very useful in business and finance where there are many random variables in play.
Further reading for Monte Carlo simulation:
- https://towardsdatascience.com/understanding-monte-carlo-simulation-eceb4c9cad4
- https://towardsdatascience.com/the-house-always-wins-monte-carlo-simulation-eb82787da2a3
New Product Development
An application of Monte Carlo simulation is New Product Development. It corresponds to the elaboration of a plan to invest in a new product, hoping to get a return in the future after a certain amount of years. Net Present Value (NPV) refers to the difference between the value of cash now and the value of cash at a future date. With Monte Carlo, we can simulate the process.

- n = number of years
- d = discount rate
- R = profit
Markov Chain
The Markov chain is a stochastic process where the future behavior (probability of an event) depends only on the current state of the process (the previous event). It means that the assumption is given all the past history of the probability distribution for a random variable, the probability on the next step only depends on the current variable.
This can be written like:

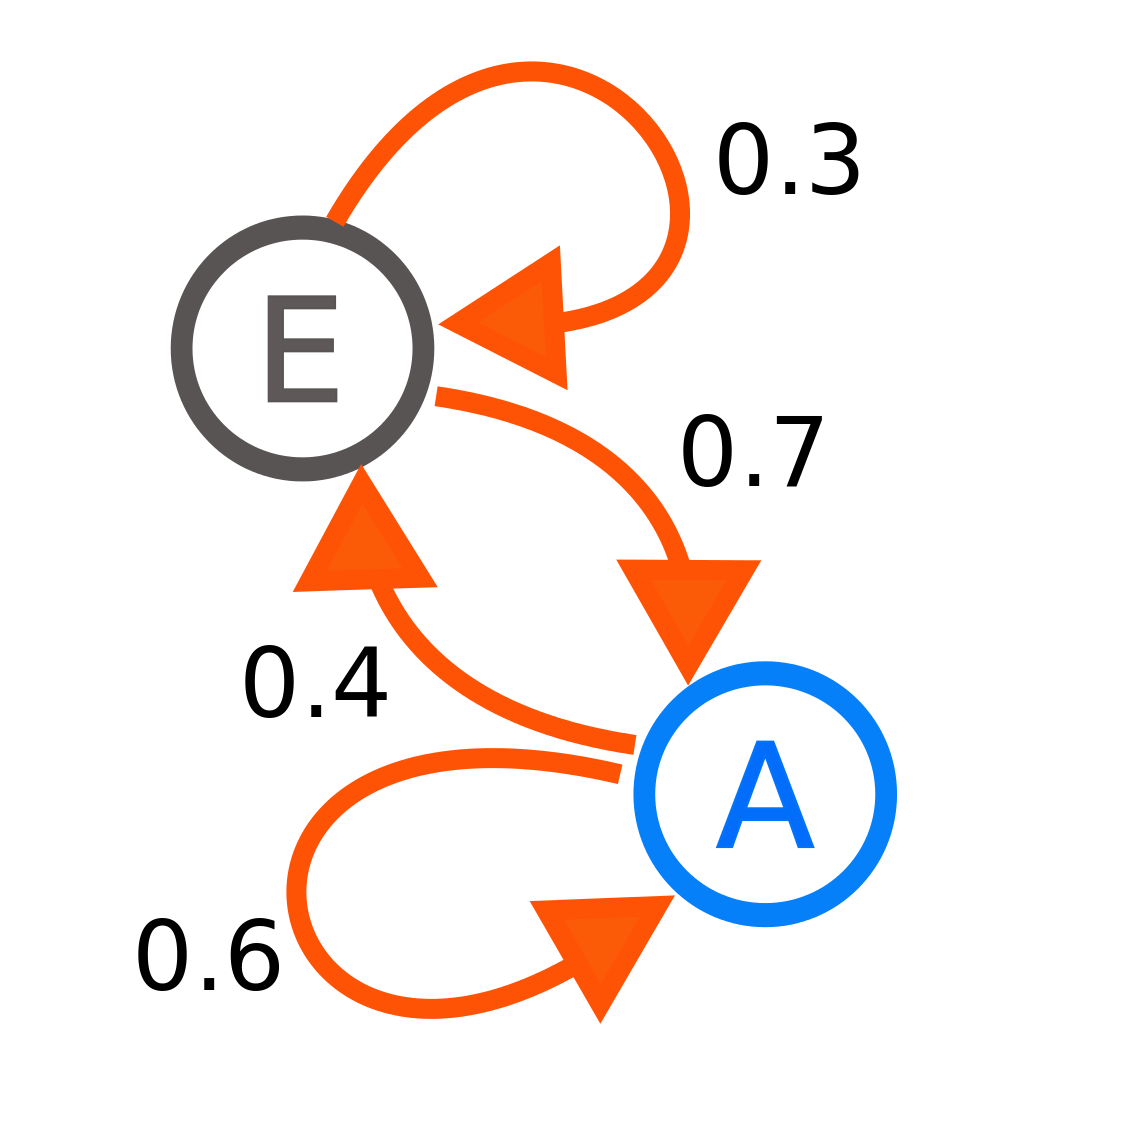
The chain can be represented as a state machine. A transition corresponds to the changes of state, and the probabilities related to each transition are called transition probability. For example, in the image, the transition probability from state A to E is 0.4. In this machine it is assumed that there is no final state, the process does not terminate.
Another assumption is that the transition probability does not change over time. Thus, the transition from time t to time t+1 depends only on the value of Xt.
Transition matrix: it is a table which indicates the probability

. For each transition, represents the graph into a matrix. Form example:


The transition matrix is useful to find the following steps’ probabilities. For instance, if you want to find

. This can be done by multiplying the transition matrix by itself n times, where n is the amount of steps further that you want to go, in this case 2.
Discrete Event Simulation (DES)
A discrete-event simulation (DES) models the operation of a system as a discrete sequence of events in time. Each of the events occurring at a particular instant in time and means a change of state in the system.
Examples are simulating queues in supermarkets, health centers, banks, simulating product production in a fabric.
A DES has the following key components:
- Entity: person or object of interest that moves through the system and makes changes in the status of the system.
- Attributes: Attributes are variables that characterize an individual entity and they are carried along with the entity when it goes through the system. Example: Age, gender, amount of money.
- Resource: A limited quantity of items that are used by entities as they proceed through the system. Each resource has a capacity that governs the total quantity of items that may be available. All the items in the resource are homogeneous, meaning that they are indistinguishable. If an entity attempts to use a resource that does not have any units available, it must wait in a queue. Examples: ATM machine, a doctor.
- Queue: is a location that holds entities when their movement is constrained within the system. Queue might have one of the following logics: FIFO (first-in, first-out), LIFO (last-in, first-out), HVF (high value first)
- Events: An occurrence or action that changes the state of the system at a particular point in time. For example: an entity arrives, an entity leaves the system.
The system is simulated for a certain amount of time. Results can show the usage of the resources and make decisions based on how to optimize the available resources, or detect if it is necessary to get more resources.
Input Analysis
In input analysis simulation is used to generate more data. The idea is to determine the distribution of the data in order to simulate it. There are some techniques to fit your data to several distributions and compare parameters to see which distribution is the best fit. This might be useful when you have missing values or you have very little data.
Conclusion
Simulating data can be helpful in many areas. You can simulate different situations to be analyzed, and find optimizations or improvements in the systems that operate those situations. You can generate more data that can be used in many ways, either to simulate incoming data to test a product, to fill missing information or to test your machine learning model.


