
In medical images, ROI is a term that refers to the Region of Interest in an image, like the boundaries of a tumor, which means this can also be a volume of interest (VOI).
After analyzing different scenarios that use machine learning to process medical images, we realized that part of the preprocessing is very similar, especially when files are processed in DICOM format.
During the preprocessing, files can contain a lot of metadata and can be quite large. This in turn makes the preprocessing time is time-consuming. Generally, about 80% of the allocated time gets spent here.
Having these standardized and automated in a framework would allow data scientists to reduce the preprocessing time to a simple query that would retrieve their required information to effectively process medical images.
To bring this to fruition, Rootstrap worked with two teams from ORT University, one to develop the required framework, and the other to implement the machine learning models needed for identifying the Region of Interest in DICOM files.
Framework
The framework is designed in a way so data scientists are the end-user and just need to worry about analyzing the available information, applying the necessary strategies in a simple manner, and having time to focus on the modeling.
The framework is responsible for processing and storing the information from the files in a data warehouse and the extracted images in a data lake. It also you to carry out transformations to the stored data, where end-users can add custom transformations and get results.
The technologies that were used for the development of the framework are AWS S3, Redshift, Python, Docker. You can find the code here.
DICOM files
DICOM aka Digital Imaging and Communications in Medicine is an international standard for medical images. It is applied in radiology, radiotherapy, cardiology, and more. The file structure can be divided into two main parts: Metadata and Images.
Metadata
The metadata contains information related to the medical study, such as the type of study, the model of the machine with which it was carried out, the starting time, and information related to the patient. The metadata can vary according to the type of study.
Example- part of the metadata
(0008, 0050) Accession Number SH: '' Modality (0008, 0060) Modality CS: 'US' (0008, 0060) Modality CS: 'US' (0008, 0060) Modality CS: 'US' (0008, 0060) Modality CS: 'MR' (0008, 0060) Modality CS: 'XA' (0008, 0060) Modality CS: 'XA' (0008, 0060) Modality CS: 'US' Manufacturer (0008, 0070) Manufacturer LO: 'Medistim' (0008, 0070) Manufacturer LO: 'Medistim' (0008, 0070) Manufacturer LO: 'Medistim' (0008, 0070) Manufacturer LO: 'Philips' (0008, 0070) Manufacturer LO: '' (0008, 0070) Manufacturer LO: '' (0008, 0070) Manufacturer LO: '' Referring Physician's Name (0008, 0090) Referring Physician's Name PN: ''
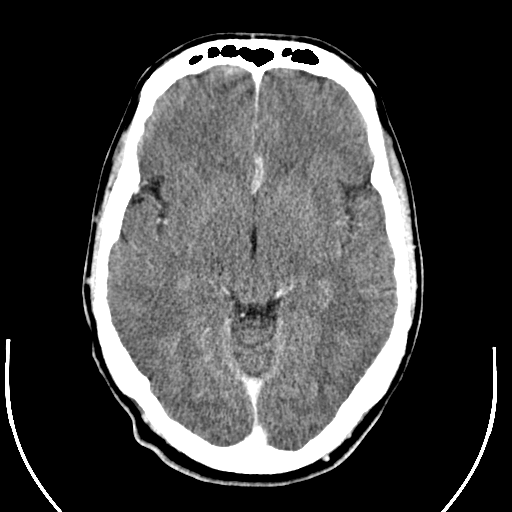
Each DICOM file contains one or multiple images. When multiple images are present, there is also metadata associated with that sequence of images.
Example of image:

There are a number of problems that are often present when processing DICOM files:
● Large size: size varies from a few MB to several GB. This makes the size of the repositories scale at a high speed.
● Varied information: depending on the type of study, the information can vary greatly from one file to another.
● Understanding the information: understanding each piece of the metadata can become complex.
● Information in sequences: files can have information in sequences, which means that some fields do not have only one value, and instead you need to process a list of values.
Transformations
During the preprocessing, it's probably best to do several ETLs (extract, transform, & load) to the data. Some of them are provided in the framework, but you can also create a custom transformation.
The supported transformations are SQL and image transformation. You will need to implement some methods using a template. Examples are provided for each type of transformation.
Architecture
The raw DICOM files are available in S3. The framework processes those files and loads the metadata in a Data Warehouse and the images in a Data Lake.
Transformations can be applied to the loaded data and queries can be made to extract the required information. The code for the processing is written in python and the data is stored in Redshift.
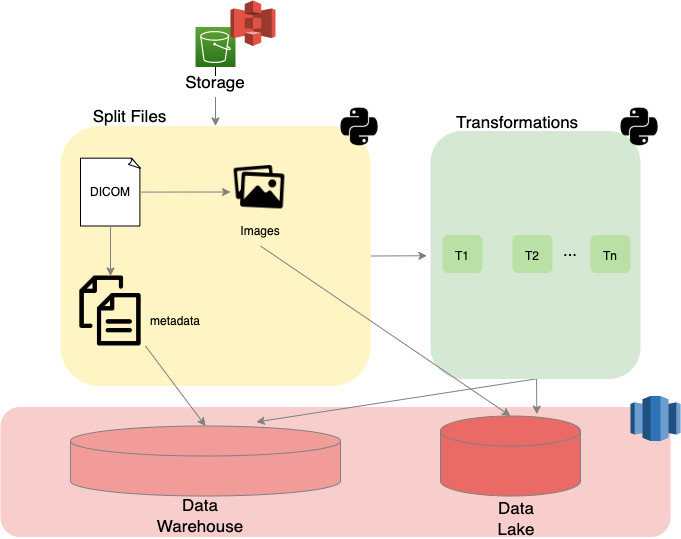
Split Files and Transformations
Split Files and Transformations
Case study: ROI identification applying machine learning
To get an example of use for the framework and validate the complete pipeline, we trained a machine-learning algorithm that needs DICOM images as an input and that can identify the Region of Interest of the images.
Another group from ORT University performed the investigation and implementation of this model. The team worked hard to overcome challenges and successfully got two models to identify the ROI in this type of image.
Once the two projects were completed, Rootstrap joined them to validate the real application of the framework by performing the preprocessing for the case study with the framework.
You can find the code we used for this experiment here.
Region of Interest
As mentioned, ROI in medical images refers to the Region of Interest of an image such as the boundaries of a tumor. Also making this area a potential volume of interest (VOI).
In this experiment, we specifically wanted to focus on medical images that follow DICOM standards.
Datasets
- Curated Breast Imaging Subset of DDSM (CBIS-DDSM) - The Cancer Imaging Archive (TCIA).
The dataset contains mammography images with the associated classification - malignant, benign, and benign without callback, selected by a trained mammographer.
For the experiment, the class ´benign without callback´ was considered 'benign' as it is out of the scope to be considered a subclass. The subset contains the information corresponding to 691 patients for a total of 1,318 images.
- Brain MRI segmentation (TCG – LGG) - The Cancer Imaging Archive (TCIA).
This dataset contains image information with their respective masks manually segmented with the information corresponding to the ROI. The dataset has 2090 images with the mask from 111 patients.
Training in both datasets was carried out to show that the architecture of the model is useful for different types of images.
The experiment
The aim of this experiment was to train a machine learning model to be able to find the ROI in DICOM images. To achieve this, we needed to investigate the different techniques being used in the industry.
Two different experiments were carried out using the following two papers as references:
- Automated Breast Cancer Diagnosis Using Deep Learning and Region of Interest Detection - this paper uses classification/detection methods to detect ROI in DICOM images.
- U-Net: Convolutional Networks for Biomedical Image Segmentation - this paper applies image segmentation to identify ROI in 2D images.
Technique #1 - YOLO
The YOLO architecture contains two networks, one that is responsible for classifying ROI crops into malignant and benign. While the other is responsible for the detection of ROI in the images.
The weights from the first network are transferred to the second network. The architecture is based on the paper, applying slight changes to get better results.
Classification:
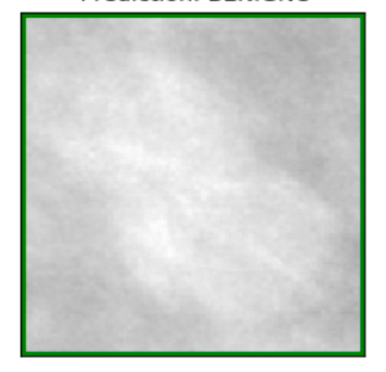
BeningMalignantBening and Malignant
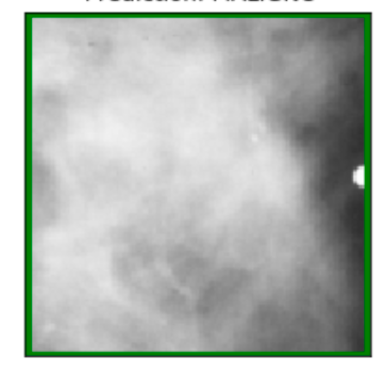
Detection:
Detection
Technique #2 - UNet
The architecture proposed in the aforementioned paper corresponds to a U-shaped architecture divided into two parts.
The first is the contraction path which corresponds to typical convolutional network architecture, and a second stage is called the expansion route.
The network is composed of 18 convolutional layers for the contraction part and 10 for the expansion.
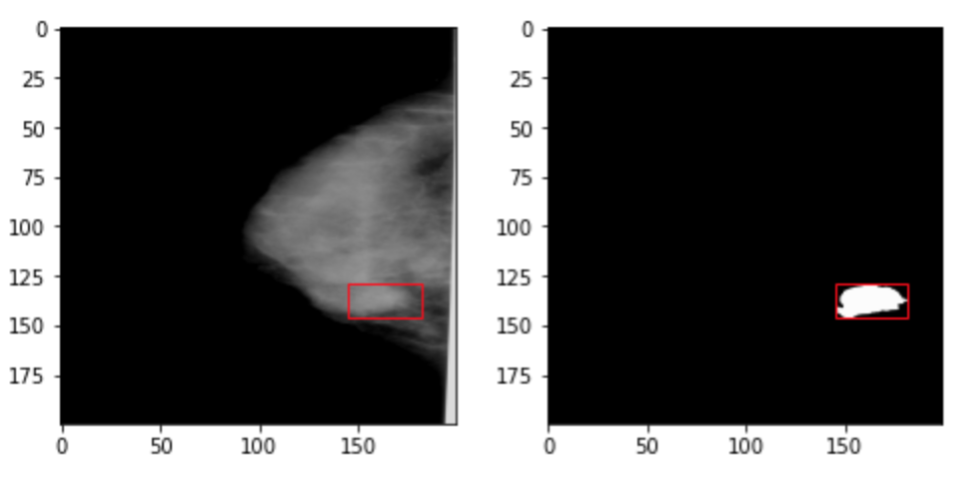
Segmentation:
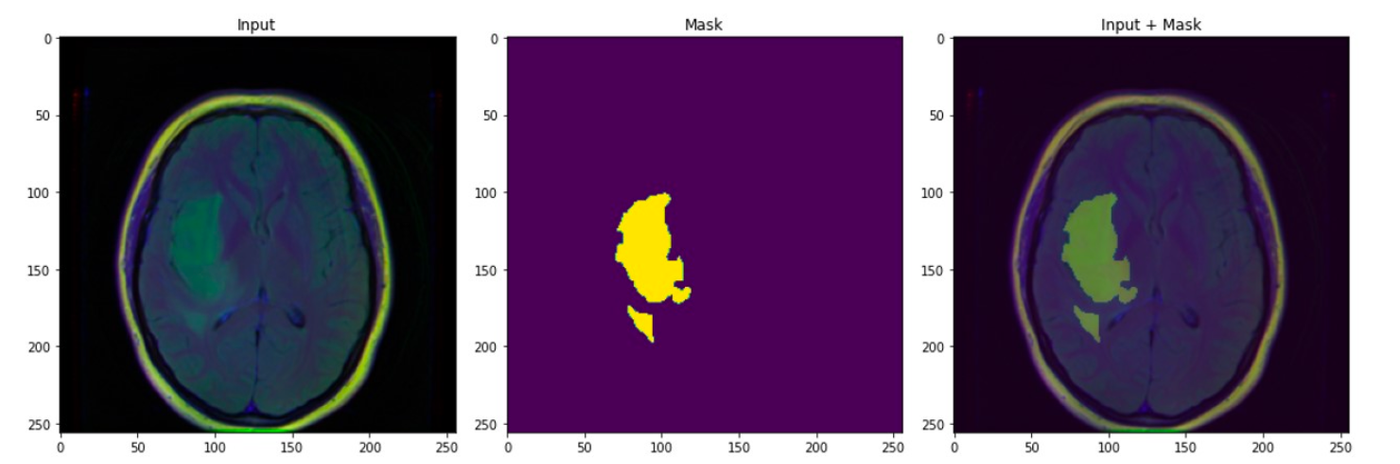
Segmentation
Metrics
Classification - for the classification problem in case 1, the accuracy metric was used to compare the results by applying the same algorithm over different training sets.
Intersection over Union (IoU) - is an evaluation metric used to compare the similarity between two arbitrary shapes. If an algorithm provides the output as predicted, bounding boxes can be evaluated using IoU. In fact, IoU is based on the volume of the region determined by bounding boxes.
IoU=A⋂BA⋃B
Results
Our team of students trained each of the algorithms with each dataset, and compared results with the selected metrics. As we can see here, both methods performed better with the second dataset. This might be because it is easier to understand.
AccuracyIoU>=0.5Yolo - dataset171.96%1.85%Yolo - dataset297%67.51%U-Net - dataset143.67%U-Net - dataset272.73%
Within the two architectures, the UNet 2.5 is the one that achieved the best IoU results. However, UNet training times are considerably larger and require more resources compared to a similar setup with BC-DROID 2.4.
While UNet with the dataset MRI BRAIN Segmentation takes approximately 12 hours to train 100 epochs, in contrast, YOLO with the same dataset trains 500 epochs in approximately 8 hours.
In the YOLO architecture, a target is passed in a specific format which includes the confidence value for each cell, its center, dimensions, and the N possible classes to which the image can belong. This requires more effort to adapt to new datasets than the UNet architecture.
What did we learn from the case study?
The necessary transformations for both models were implemented in python, so it wasn’t a problem with the integration. Here are some key takeaways we learned during the process:
An important fact - we realized that the training of the algorithms can also be modeled as a transformation. Here, it was necessary to use python with GPU to accelerate the process.
Separated environments - we learned that it's better to separate the python environments for each transformation to prevent any dependency errors.
For future work - as well as improving the framework and documentation, we realized it would be useful to provide integration with Jupyter notebooks for the transactions. This would allow you to work with the data and load python output results in the notebook.
Processing time - although the preprocessing time for only one case study with or without the framework is the same, if we want to apply other machine learning models to the same data it is only necessary to implement the model, and the preprocessing is saved in the framework.
Overall conclusion
The machine learning models implemented in our case study show the potential and power that machine learning can have in the medical industry.
Using more realistic images for training and testing the model would improve the performance and detect with more precision the ROI.
This might help doctors to faster detect tumors and take action before it is too late. Several advantages are thrown from the use of the framework:
- Customizable: the framework resolves each part of the pipeline and is extensible to create our custom transformations.
- Open source: the code might be extended to support commonly used transformations over time. We will be updating the repository to provide a more robust framework that might help other developers to resolve similar problems.
- Scalability: the framework can be scaled vertically and horizontally.
Also, in the future, researchers might be able to share data through a framework having already preprocessed a lot of information, having more time to focus on the development of the algorithms, and reach more precision with them since they have more data.


