
A Brain-Computer Interface (BCI) is a system that measures neural activity to convert into outputs for executing different actions or control commands.
To get an idea of these tools, it's important to understand Electroencephalography (EEG) signals, and how the brain’s electrical activity can be recorded using electrodes that are fixed on the scalp.
Some studies show that it is possible to accurately perform algorithms to detect eye movements from EEG and execute different actions according to the signal. This could help people with disabilities to control objects or execute tasks by themselves.
Several studies have been done using electrodes to record the signal, and train ML algorithms to identify with precision the signal that is being used. Little work has been done in the field with less sophisticated devices using fewer electrodes, and with more financial availability for people.
For this reason, this study aims to show that it is possible to capture EEG data with a low-cost device and with very few electrodes, to effectively create an algorithm that detects left and right eye movements.
To perform this experiment, Heart and Brain SpikerBox from Backyard Brains was used to record the "electricity" of the eye. When the eyes move, it creates an electrical deflection that can be measured, it is called Electrooculographic Signal (EOG).
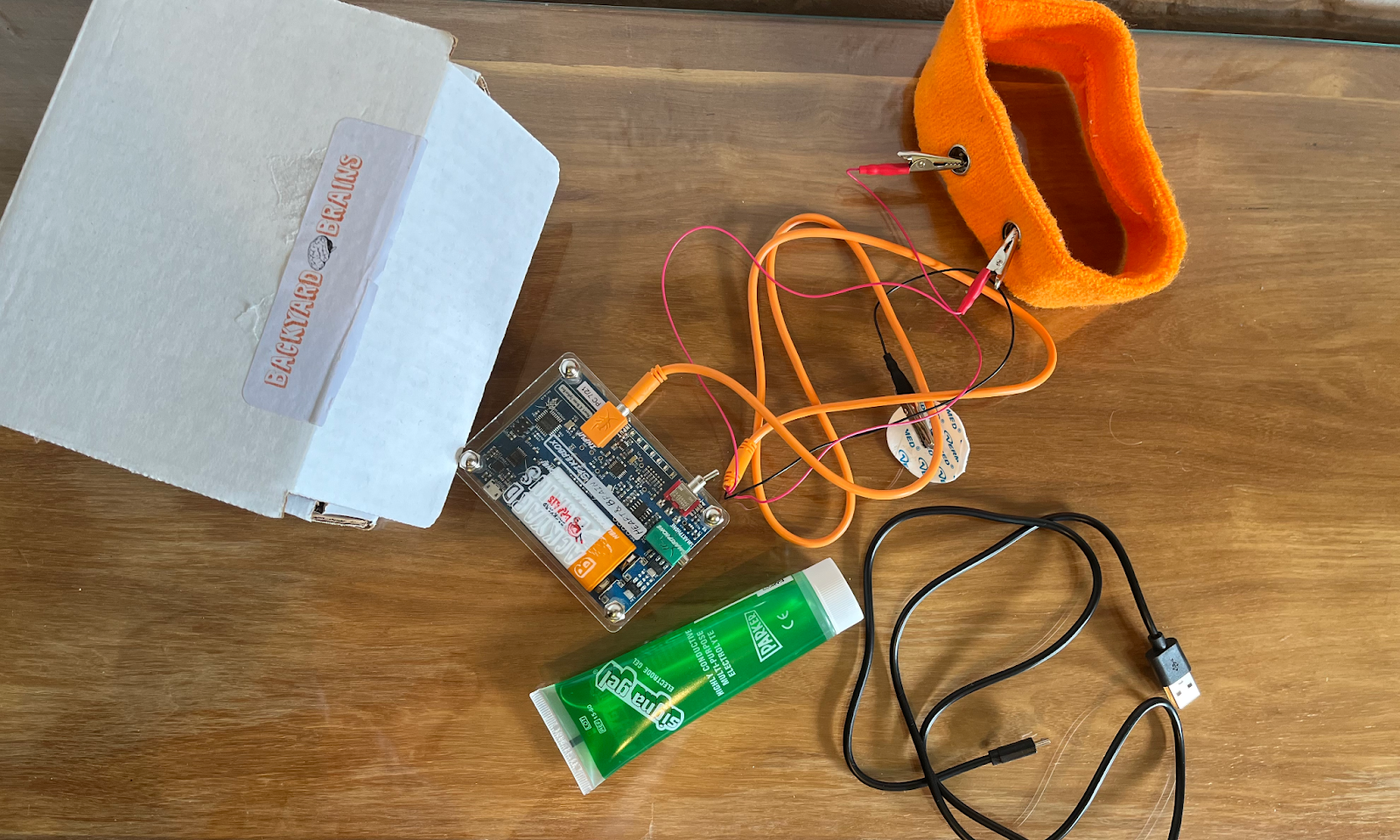
Heart and Brain SpikerBox from Backyard Brains
Recording Data
The device has two electrodes that should be placed on either side of the eye so that we can detect both left and right eye movement. The 3rth electrode should be on the ground, behind the ear. This is connected with a device with just one serial channel connected to the computer. The app SpikerRecorder reads this data and exports it in a .wav format.
So far, 57 recordings (30 left and 27 right) of approx 3 seconds on one person have been conducted. Each recording is in one file in .wav format.
This data is being pre-processed to help train a machine learning model that identifies between both left and right classes. In this case, we have used 80% of the data for training the model, and the rest for testing.
Data Visualization
Frequencies
The electroencephalogram (EEG) is a recording of the electrical activity of the brain from the scalp. The recorded waveforms reflect the cortical electrical activity. Frequency refers to a rhythmic repetitive activity (in Hz). Let's look at the frequencies values.
Left frequency values:
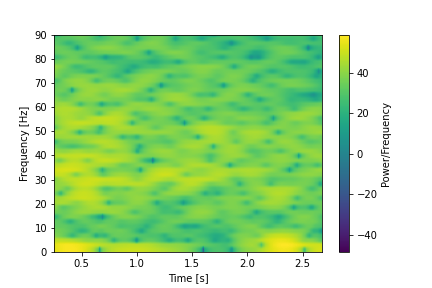
Left frequency values
Right Frequencies Values:
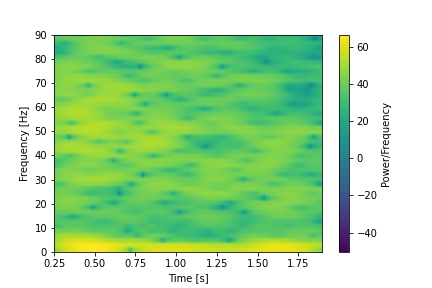
Right frequency values
Amplitude
Looking at the amplitude graphs, we can see that there might be a pattern. The first large peak for data corresponding to left eye movements goes down, while for an eye right goes up.
The paper 'Classification of Four Eye Directions from EEG Signals for Eye-Movement-Based Communication Systems', mentions these tendencies among eye movements at the amplitude values.
Left Amplitude:
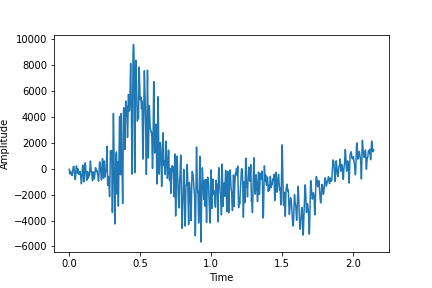
Left amplitude
Right Amplitude
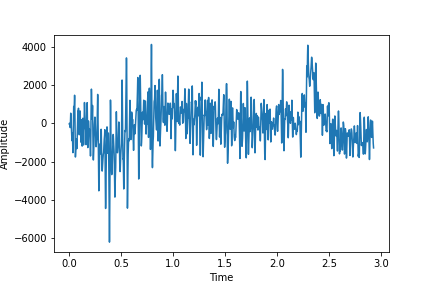
Right amplitude
Preprocessing
The brainwaves or neural oscillations are characterized by their frequency, amplitude, and phase. These signal properties can be extracted from neural recordings using time-frequency analysis.
In general, EEG signals have oscillatory activity in specific frequency bands:
- delta (0.5 to 4Hz)
- theta (4 to 7Hz)
- alpha (8 to 12Hz)
- sigma (12 to 16Hz)
- beta (13 to 30Hz)
Since the recordings are around 4 seconds long, it has several frequencies values over time. For each band (or wave), we took 3 values around time: first, median, and last value. Having in total for each recording 15 values = 5 (waves) * 3 (values in time).
We loaded this information into a data frame and added the associated class (left, right), and the associated filename. This way, the data is ready for the execution of the model.
Model
According to the paper 'EEG-Based Eye Movement Recognition Using Brain-Computer Interface and Random Forests', the best model for recognition of eye movement has been Random Forest.
In this paper 32 electrodes were used, classifying 6 classes, and corresponding to different eye movements (eyes open, eyes closed, eyes left, eyes right, eyes up, and eyes down). The results were outstanding, reaching an accuracy of 85.39%.
In our specific case, the challenge was to validate that it is possible with fewer electrodes to reach high accuracy. We reached an accuracy of 0.8 with 2 classes (left and right).
Looking at the confusion matrix below, we can see that the error is more related to the cases that originally class was right, but the model predicted left.
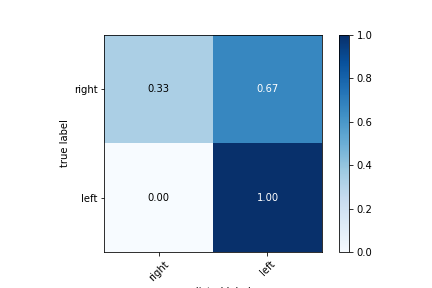
Confusion matrix
You can find the code for this in the following repo.
Next steps
Here's what's up next as we continue our experiment with machine learning and neuroscience:
- Get more data from different people.
- Tune the model with hyperparameters.
- Use other algorithms to train the model and compare the results.
- Add more classes i.e. extend to up and down, and eyes open and closed.
- Capture real time data using this python client to get EEG data directly from the serial port.
- After that process, use the information to generate actions creating a brain computer interface.
We hope you enjoyed learning about this ongoing experiment. Feel free to leave any opinions, recommendations, or feedback as we move on in our research. Stay tuned for more.


